Bollinger Bands - all you need to know

In the world of financial markets, traders are often on the lookout for reliable indicators to help their decision-making process when it comes to their traders. Among the plethora of technical analysis tools available, Bollinger Bands is a top indicator used by traders almost everywhere in the world. It was created by John Bollinger in the 80s, who happens to be a technical trader. He was on a mission to provide traders with a tool that is able to recognize instances and patterns of extreme short-term prices in a financial asset and to measure market volatility.
The indicator is created by plotting the average of a predetermined number of prices (shown as green and red candles in the image below), along with two trading bands above and below.
The other bands are created by simply subtracting and adding one standard deviation from the moving average. Standard deviation is used to create this indicator because is a common measure of volatility. The standard deviation changes as volatility increases or decreases. When the price rises, the bands widen, and when the price falls, the bands contract. Under normal conditions, traders will nearly always find the price of a financial asset to trade within the bands. The bands will expand and contract as the price action of the security is being studied.
One of the main concepts to understand when using this indicator is that periods of low volatility generally tend to be followed by large periods of high volatility and vice versa.
In simple words, if a trader notices that the Bollinger bands start to pinch together, there’s a reasonable chance that the volatility will increase and a trading opportunity will soon appear. Another method of using Bollinger Bands is to note when the price of a security
moves beyond the upper or lower barriers. When the price moves above the upper band prices tend to be overbought and your position could be due to a pullback. Conversely, a move below the lower band suggests that the price is oversold triggering a buy signal.
Identifying prices that take a move beyond the bands helps traders take advantage of unjustifiably high or low prices.
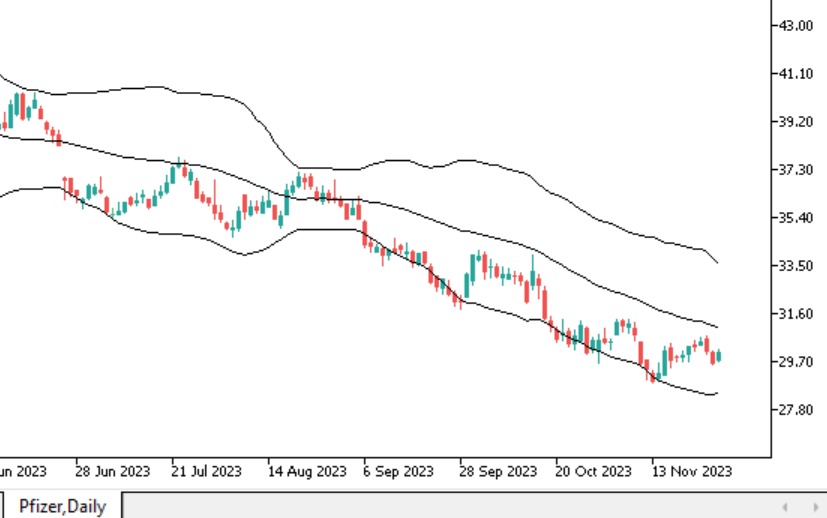
*Bollinger bands in MetaTrader 5.
How to calculate Bollinger Bands?
A Bollinger Band is distinguished by tree lines called trendlines. These trendlines are constructed by situating two standard deviations (Standard deviation is a mathematical measurement of average variance and features prominently in statistics, economics, accounting, and finance), both in a positive and negative direction, and an SMA. (A simple moving average calculates the average of a selected range of prices, usually closing prices, by the number of periods in that range,)
- Middle Band (SMA): The central line represents the simple moving average (SMA) of the asset's price over a specified period. The default is usually set to 20 periods.
- Upper Band (Standard Deviation): This line is plotted above the SMA and is derived by adding a specified number of standard deviations (often 2) to the SMA.
Lower Band (Standard Deviation): Similar to the upper band, this line is plotted below the SMA by subtracting the same number of standard deviations.
The trader determines how many standard deviations to set the volatility indicator. The number of standard deviations determines the distance between the middle band and the upper and lower bands. The position of these bands indicates the strength of the trend and the potential maximum and minimum price levels that can be expected in the near future.
The initial step in computing Bollinger Bands involves determining the simple moving average (SMA) of the security, commonly using a 20-day SMA. This 20-day SMA aggregates the closing prices for the first 20 days to form the initial data point. The next data point drops the earliest price, adds the price on day 21 takes the average, and so on. Next, the standard deviation of the security price will be obtained.
For a given data set, the standard deviation measures how far numbers are from an average value. Standard deviation can be calculated by taking the square root of the variance, which itself is the average of the squared differences of the mean.
Next, multiply that standard deviation value by two and both add and subtract that amount from each point along the SMA. Those produce the upper and lower bands.
BOLU=MA(TP,n)+m∗σ[TP,n]
BOLD=MA(TP,n)−m∗σ[TP,n]
where:
BOLU=Upper Bollinger Band
BOLD=Lower Bollinger Band
MA=Moving average
TP (typical price)=(High+Low+Close)÷3
n=Number of days in smoothing period (typically 20)
m=Number of standard deviations (typically 2)
σ[TP,n]=Standard Deviation over the last n periods of TP
Bollinger bands limitations
The use of Bollinger Bands has limitations. It's important to note that Bollinger Bands® is not an independent trading system but rather a single indicator aimed at offering insights into price volatility. John Bollinger recommends combining them with two or three other unrelated indicators that offer more immediate market signals and are based on diverse types of data. Among his preferred technical methods are moving average divergence/convergence (MACD), on-balance volume, and relative strength index (RSI).
Strategies to Consider when using this indicator
Bollinger Band Squeeze Breakout: A trader should look for periods of low volatility (narrow bands) and anticipate a potential price breakout. Traders can place buy or sell orders above or below the breakout level.
Reversion to Mean: When the price touches or crosses the upper or lower band, traders anticipate a reversal towards the middle band, prompting potential entry or exit points.
Divergence: Analyze price movement compared to the bands. The divergence between the price and the bands could signal a potential change in trend direction.
Conclusion
Bollinger Bands remains a powerful tool for traders in analyzing market volatility, identifying potential entry and exit points, and price reversals. When integrated into MetaTrader 5, this indicator offers traders a comprehensive view of market dynamics, aiding in informed decision-making and enhancing trading strategies.
Remember, no single indicator guarantees success in trading, but understanding how to effectively use Bollinger Bands within MetaTrader 5 can significantly enhance a trader's technical analysis toolkit.
LimitPrime © 2026
Begin to invest and
start earning today!
Categories
Do you need personalized assistance?
READ MORE INTERESTING ARTICLES
What Is Moving Average Convergence/Divergence (MACD)? Even under ideal circumstances, learning to trade in the right direction of marke...
Read More
When a trader makes an investment decision, he gets exposed to a number of financial risks. The quantum of such risks depends on many f...
Read More
A hedge is a measure taken to reduce the risk of volatile price movements in an asset. A hedge is an investment that consists in taking...
Read More