Moving Average Convergence/Divergence - MACD

What Is Moving Average Convergence/Divergence (MACD)?
Even under ideal circumstances, learning to trade in the right direction of market movements can be challenging, but it becomes much more unpredictable when a trader is uninformed of the right instruments that can be of assistance when trading. On that note, we are here to help you understand one of the most commonly used indicators by traders globally.
Although the name of this indicator, created by Gerald Appel, sounds highly complicated, using it is pretty easy. Originating in the 1970s MACD is a popular technical indicator used to identify momentum in the market; it stands for Moving Average Convergence Divergence and shows the relationship between two moving averages in a financial asset. As an oscillator of momentum, the Moving Average Convergence/Divergence indicator is usually implemented in trend trading. This oscillator is very rarely put in a situation where it needed to spot overbought or oversold positions. But that doesn’t mean it’s not used in any. Typically, it shows two lines that oscillate on a given graph. Similar to a two-moving average technique, trade signals are generated when the two lines cross.
Unlike most technical indicators, which only provide one piece of historical price data, the MACD indicator is a versatile 2-in-1 indicator that measures both trend direction and trend strength.
MACD enables you to:
Based on the relationship between the two moving averages, predict what is the current trend direction (bullish or bearish) and forecast in which direction the price is more likely to go.
- Calculate the rate of change in asset prices, also known as the trend's speed or momentum. MACD momentum readings can help traders determine the strength or weakness of a trend.
How does the MACD indicator in Meta Trader 5 work?
Understanding the MACD indicator's specifics on the chart is essential for understanding how to successfully use it.
The MACD indicator is made up of two major components:
- MACD line — fastest moving average (short-term EMA)
- Signal line - the slowest moving average (long-term EMA)
1. MACD line - fastest moving average (short-term EMA)
The MACD indicator formula is calculated by subtracting the 26-day long-term exponential moving average (EMA - exponential moving average, which measures trend direction over a certain period) from the 12-day short-term EMA. It is typically blue.
Formula: Line MACD = (12-day EMA minus 26-day EMA)
2. Signal line - the slowest moving average (long-term EMA)
This is a 9-day line that is usually colored red.
9-day EMA MACD line = signal line.
But some other indicators might have a third line called MACD histogram. This line oscillates above and below the zero line, assisting in the identification of bullish and bearish momentum readings. The difference between the first two elements is the histogram (the MACD line minus the signal line). The histogram is positive when the MACD is above the signal line, and vice versa.
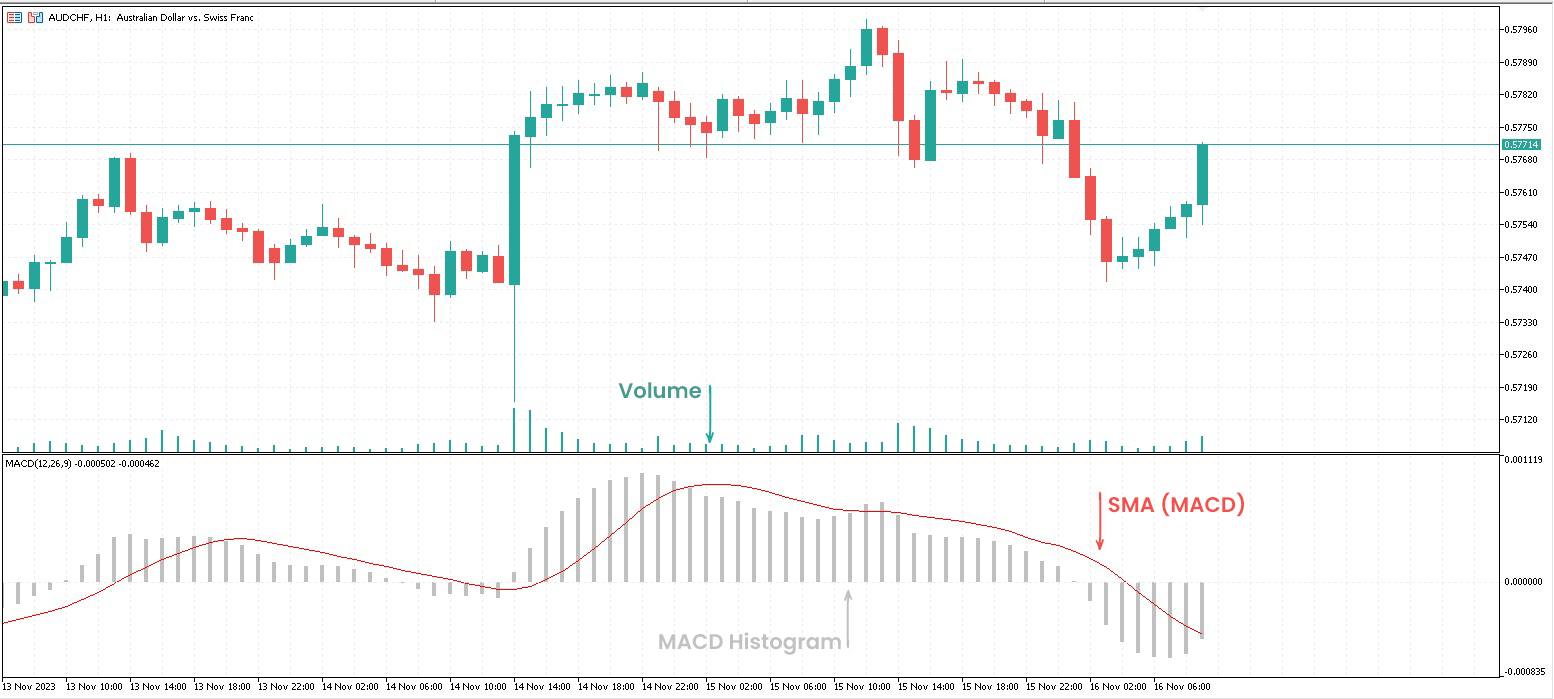
*MACD in MetaTrader 5
MACD in depth
The MACD is used in a variety of ways. You can use signals to buy or sell orders that occur at times when the MACD and signal line cross. They are called crossovers.
In the additional example, learn how crossovers work:
- When the MACD line crosses ABOVE the signal line, traders use this as a BUY indication.
- When the MACD line crosses BELOW the signal line, traders use this as a SELL indication.
The MACD can also be used as an indicator of overbought/oversold conditions. When the shorter moving average diverges significantly from the longer moving average (i.e., the MACD line rises), the price of the asset is likely to be overextended and will soon return to more realistic levels.
The last way to use the MACD indicator is in times when you want to identify what will happen to a certain trend. An indication that an end to the current trend may near occur when the MACD diverges from the symbol. When the price of an asset, such as a stock or currency pair, is moving in one direction and the MACD's indicator line is moving in the other, that's divergence.
MACD vs. RSI indicator
The relative strength index, or RSI for short, is another indicator that traders frequently use to improve their strategies. Both MACD and RSI aid in determining market momentum and overall direction, but they do so in slightly different ways.
RSI indicator signals are read correctly by looking at their values, which range from 0 to 100. When the RSI falls below 30, it indicates that the market has been oversold and that the asset price will likely rise soon. When the RSI rises above 70, the market is considered overbought, and the price is expected to fall.
The MACD measures the difference between two moving averages, whereas the RSI measures price changes about recent highs and lows. Because these two indicators focus on different factors, the "buy" and "sell" signals they generate can sometimes be opposed.
Conclusion
MACD is an excellent tool for any trader due to its simplicity and precision, as it combines market momentum and trends into a single indicator. The MACD indicator, as a comprehensive indicator, allows for a less cluttered chart and provides much better insight into price action. Always watch for other signals and never make trading decisions strictly based on MACD signals.
LimitPrime © 2026
Begin to invest and
start earning today!
Categories
Do you need personalized assistance?
READ MORE INTERESTING ARTICLES

In the world of financial markets, traders are often on the lookout for reliable indicators to help their decision-making process when...
Read More
When a trader makes an investment decision, he gets exposed to a number of financial risks. The quantum of such risks depends on many f...
Read More
A hedge is a measure taken to reduce the risk of volatile price movements in an asset. A hedge is an investment that consists in taking...
Read More