What are Fibonacci Numbers and how to use them for Market Analysis?
Being familiar with the market, we know that it is one unpredictable place where the prices fluctuate significantly on a daily, and sometimes even on an hourly basis. Those fluctuations often create trends where the price goes upwards or downwards for some time before bouncing in the opposite direction. Impulses are price movements that go in the same direction as the trend and pullbacks are price movements that go against the trend.
One of the ways to determine the movement of the price on a certain chart is the usage of Fibonacci numbers in trading analysis.
There are many people who believe that the Fibonacci tool is a really good market indicator, but there are other traders who believe that these numbers are just useless lines on the chart.
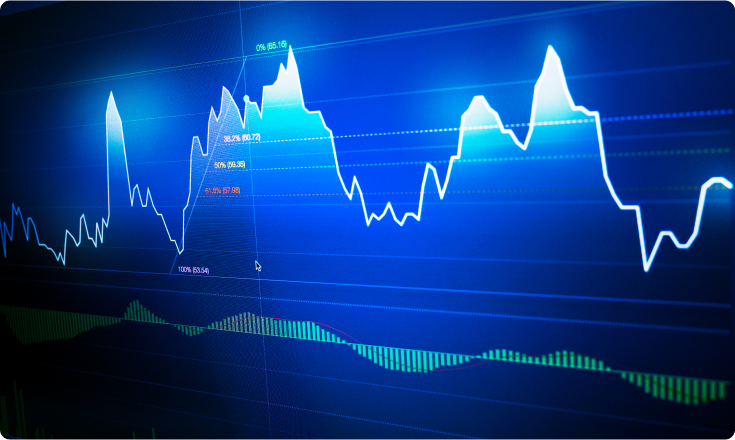
Fibonacci retracements and ratios can help traders to identify upcoming support and resistance levels based on past price action.
He was a medieval mathematician who created a sequence of numbers. These numbers can be used as retracement levels in order to detect price levels where a pullback can retrace and go back to the trending direction. Because of that, they can be a useful tool in spotting good entry points for trend-trading.
Before we go into the details of how you can use Fibonacci Numbers and retracements to profit from the unpredictable market, let’s take a look at what Fibonacci Numbers are.
What Are Fibonacci Numbers?
Fibonacci levels are derived from a number series that Italian mathematician Leonardo of Pisa - also known as Fibonacci - introduced during the 13th century. The Fibonacci Numbers sequence goes like this:
0, 1, 1, 2, 3, 5, 8, 13, 21, 34, 55, 89…
Why is this series of numbers so important?
Because of Fibonacci's golden ratio.
The focus is on the ratio between the numbers in the sequence. This is considered to be the most important part of Fibonacci's work. Any number in the series divided by the previous number gives us 1.618 as we get further down the line. This is the famous 'Fibonacci golden ratio'. For Fibonacci’s followers and lovers of his work, there are plenty of examples found in nature mimicking this ratio (or the inverse of the number, 0.618). It seems that the golden ratio has played a huge part in the building blocks, cells, organisms of everything around us.
Giving us this example, if you divide the number of female bees by male bees in a hive, you will get 1.618 as the answer. For sunflowers, each new seed is 0.618 of a turn from the last one. The Fibonacci sequence applies to humans as well. There are many proofs of this golden ratio working in relation to our bodies: one example is the ratio of the length of your forearm to your hand, which is 1.618.
In the financial markets, the Fibonacci golden ratio has the same mathematical base as the natural creations mentioned above. When traders use the golden ratio in their technical analysis, the ratio is usually translated into three percentages. We can see that each number in the line which is mentioned before is the sum of the two numbers. As the sequence goes on, each number is approximately 61.8% of the next number, approximately 38.2% of the following number, and approximately 23.6% of the number after that. Deduct 23.6 from 100, and the result is 76.4.
These numbers are the Fibonacci retracement levels: 76.4, 61.8, 38.2, and 23.6 (although in trading 50% is also commonly used).
Numbers that form the basis of Fibonacci trading are related in some interesting ways.
Here are some of the most significant ones that you will need to get familiar with in order to proceed to Forex Fibonacci trading strategies later in the article:
- Dividing a number of the Fibonacci sequence with a previous number will approximate to 1.618. That is the most important level in Fibonacci extensions.
- Dividing a number by the next highest number will approximate it to 0.618. The 61.8% Fibonacci retracement level is based on this number.
- Dividing a number by another that’s two places higher up will approximate it to 0.382. The 38.2% Fibonacci retracement level is based on this number.
How To Use Fibonacci Retracement Levels
Fibonacci retracement levels can be used to establish entry price levels by providing price levels of support and resistance where a trend reversal happens.
When the price goes up significantly, traders measure the price level to which the price could retrace before going even higher and continuing the upward trend.
When the price goes down significantly, traders measure the price level at which the price could retrace before going lower and continuing the downward trend.
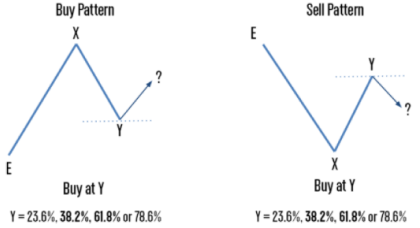
When the market is in an upward trend, the buy pattern should be used. Traders calculate how far the price could retrace after the E to X price moves before it bounces back up after hitting the Y price level.
When the market is in a downward trend, the sell pattern should be used. Traders calculate how far the price could retrace after the E to X price move before going back up and hitting the Y price level.
Besides the two levels shown above, Fibonacci trading ratios of 23.6% and 78.6% are also used by investors. Traders often use other technical analysis tools such as trading indicators or price action trading patterns in order to confirm which Fibonacci retracement level will happen.
Fibonacci trading strategies
Fibonacci retracement lines are used by traders as part of trend-trading strategies. If a retracement is taking place within a trend, you could use the Fibonacci levels to place a trade in the direction of the underlying trend. The idea is that there is a higher chance an asset’s price will bounce from the Fibonacci level back in the direction of the original trend.
Fibonacci levels can be useful if a trader wants to buy a particular assed but has missed out on a recent uptrend. In this situation, you could wait for a pullback. By plotting Fibonacci ratios such as 61.8%, 38.2% and 23.6% on a chart, traders may identify possible retracement levels and enter potential trading positions.
Fibonacci levels can be used across many different trading strategies, such as the ones listed below:
- Combining Fibonacci retracement lines with the MACD indicator. Moving average convergence divergence (MACD) is a trend-following momentum indicator that shows the relationship between two moving averages of a security’s price. This strategy looks for a crossing over of the MACD indicator, when a security’s price touches an important Fibonacci level. When this happens, a position can be opened in the direction of the trend.
- Combining Fibonacci levels with the stochastic indicator. This two-line indicator can help identify overbought and oversold levels. The strategy looks for key signals from the stochastic indicator when the price touches an important Fibonacci level. The two signals together indicate an opportunity to open a position.
- Fibonacci retracement levels can be used across multiple timeframes, but are considered to be most accurate across longer timeframes. For example, a 38% retracement on a weekly chart is a more important technical level than a 38% retracement on a five-minute chart.
As with all technical analysis tools, Fibonacci retracement levels are most effective when used within another strategy. Using a combination of several indicators gives a chance to more accurately identify market trends, increasing the potential for profit. As a general rule, known in trading the more confirming factors, the stronger the trade signal.
Conclusion
Not all traders are big fans of the Fibonacci approach to market analysis. However, even for the skeptical people out there, it can give some sort of insight, guidance and information on how to potentially profit on the market when following a trend-trading strategy.
Fibonacci Numbers allow traders to better understand market retracements and profit from them. While they are an advanced technical analysis method, they are well worth studying since their utility has been proven time and time again. Fibonacci Numbers can be used independently, but in order to get the most accurate picture of future price movements, it’s best to use them together with other technical analysis tools.
Sources Consulted:
1. Mitchell C. Fibonacci retracement levels in day trading. (2021). https://www.thebalance.com/how-to-use-fibonacci-retracement-levels-when-day-trading-1031211
2. Vonko D. Understanding Fibonacci Numbers and their value as a research tool. 17 Feb (2021) https://www.investopedia.com/articles/trading/06/fibonacci.asp
3. Solanki J. Fibonacci trading strategy guide - Fibonacci retracement levels. Admirals; (2021). https://admiralmarkets.com/education/articles/forex-strategy/fibonacci-forex-trading-strategy
LimitPrime © 2026
Begin to invest and
start earning today!
Categories
Do you need personalized assistance?
READ MORE INTERESTING ARTICLES
In the world of financial markets, traders are often on the lookout for reliable indicators to help their decision-making process when...
Read More
What Is Moving Average Convergence/Divergence (MACD)? Even under ideal circumstances, learning to trade in the right direction of marke...
Read More
When a trader makes an investment decision, he gets exposed to a number of financial risks. The quantum of such risks depends on many f...
Read More