What Are Support And Resistance Levels?
Support and resistance levels are among the most important aspects of technical analysis. All other technical analysis methods and factors rely on information about support and resistance levels.
While these levels can be very important in determining the next price movement of an asset, it’s important to understand what they are and why they can be so useful.
What are Asset Support Levels?
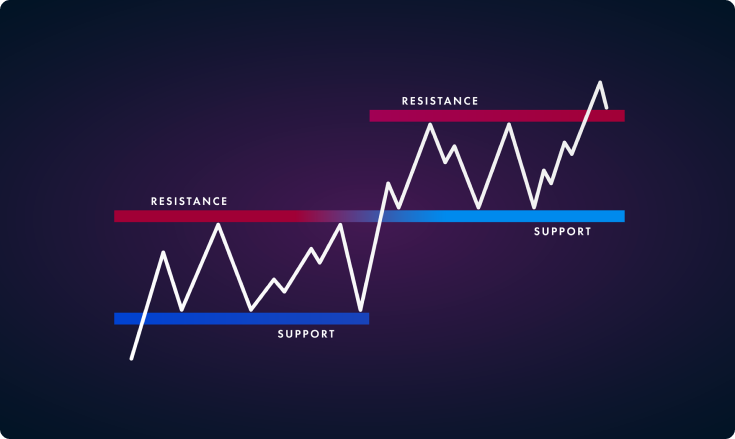
Support is the lowest level that an asset’s price comes down to under selling pressure. It represents the price at which the majority of traders think that the asset is underpriced so they start buying it up again because they think they can later sell it for a higher price.
This new wave of purchases causes the price of the asset to go up. Once the support level is identified, it can be used as a good entry point for opening up a position in that asset. More often than not, that decision will prove to be correct and can net you small profits right away.
However, it’s important to keep in mind that the price can sometimes drop beyond the former support, and then we have a new level below it that will serve as support.
What is Resistance?
The exact opposite of support, resistance happens when the asset’s price is under too much buying pressure and becomes overpriced. This is the level at which most traders decide to sell the asset and take a profit because they think that the current price is unrealistic. Traders think that the price will drop soon and they don’t want to be the ones left behind when it goes down and reduces their profits.
Just like support levels, resistance levels can be overcome if the price goes above the current resistance levels.
How to determine support and resistance levels?
It’s crucial to understand that support and resistance levels are estimates and not necessarily exact prices. It’s much better to focus on estimated price zones rather than a specific price number. That allows for more flexibility and it’s less likely that you will miss out on potential gains if you don’t focus on the exact price level.
Just like many other technical factors, support and resistance are more psychological than actually fueled by some concrete market events.
The price stops falling if people think it’s fallen enough and that it will go up, the price stops rising if people think that it has finished its movement upwards and will go down from now on.
There are a couple of ways to predict support and resistance levels and some of the most common ones are trendlines, moving averages and round numbers.
Trendlines
Trendlines are necessary for predicting the support and resistance levels because the price of an asset usually trends either upwards or downwards.
The trend can be ascending, descending, or sideways (which often doesn’t last long).
When the market is in an uptrend, resistance levels start forming as the purchase action slows down and starts to move back toward the trendline. This happens because traders start taking profit or some news comes out which causes a short-term selling pressure. As a result of that, the price declines slightly and we have found a resistance level.
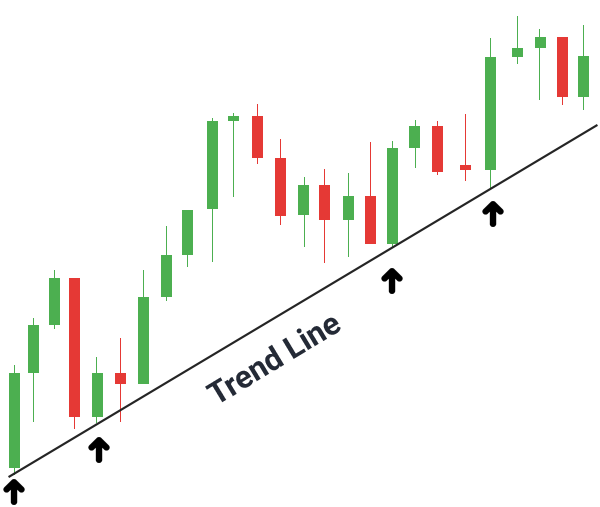
Since the market is still in the uptrend that means that the price will probably start bouncing back up after it drops slightly since the traders still believe that the asset is a good investment, just not at the price where we saw the resistance happen.
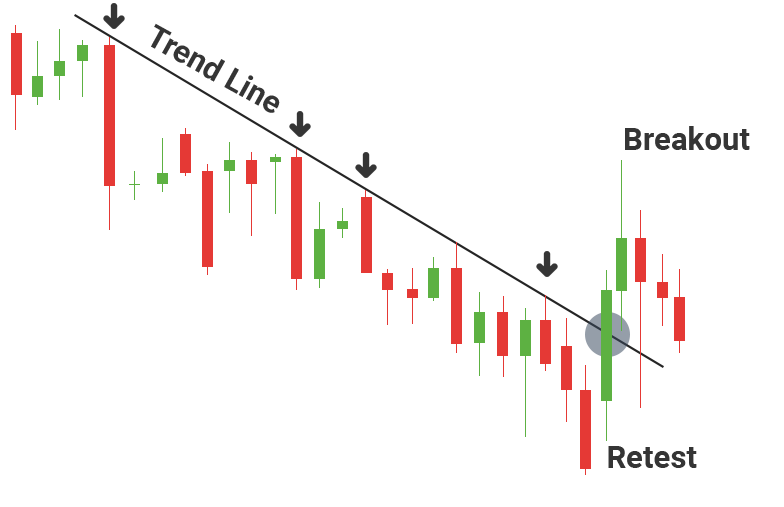
If the market is in a downtrend, traders can see a series of declining price peaks which form a descending trendline. As the price gets closer to the trendline, traders wait for the asset to go under selling pressure. When it happens, it’s a signal that it’s a good time to short the asset as it’s met the resistance level and will now start falling.
Moving Averages
A moving average can be represented with a line that smooths out previous price data and thereby allowing trades to detect future support and resistance levels. The price of an asset finds the moving average support during uptrends while during downtrends it finds the moving average resistance.
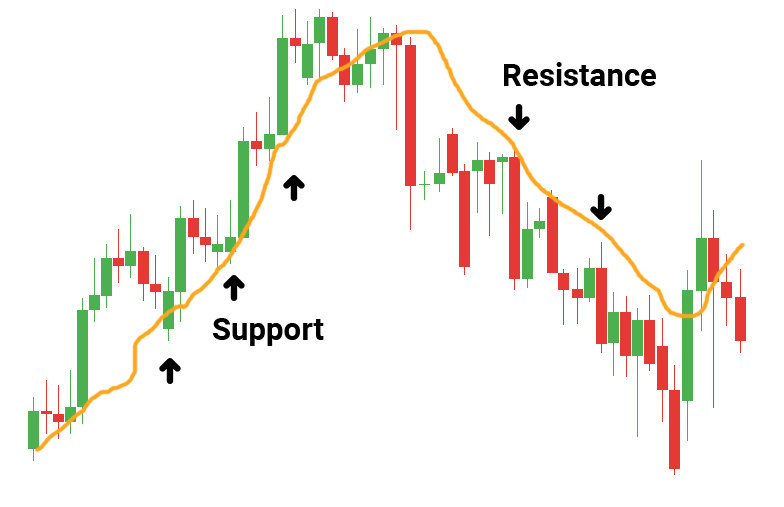
Moving averages can be used for anticipating moves towards the upside when the price goes above a moving average or for exiting positions when the price drops below the moving average. The moving average usually creates automatic support and resistance levels which makes it very useful in predicting future price movements.
Traders usually test different time periods when using the moving average in order to find the most suitable one for their needs.
Round Numbers
While at first glance it might seem too simple, round price levels can be good support and resistance prediction method. The reason behind is that most inexperienced traders tend to have psychological levels which they set their buying and selling positions at and they usually set them at round numbers like 10,000, 15,000, etc.
Likewise, most stop orders set by retail investors and investment banks are placed at round price levels. Since many of those orders are set at the same level, round numbers can be a great way to predict the levels at which the price will meet support or resistance.
Conclusion
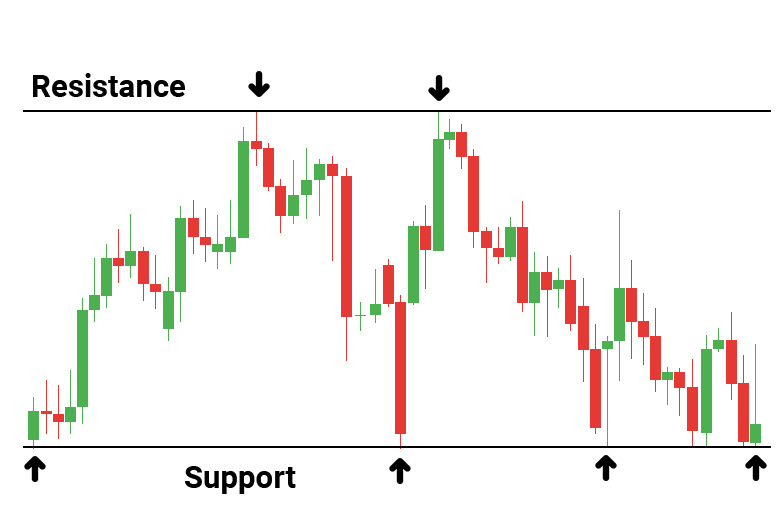
Support and resistance are some of the concepts that are most used in technical analysis. Support and resistance levels can be thought of as the floor and ceiling of the prices that we can expect.
Predicting future support and resistance levels can greatly improve your short-term trading returns. Buying an asset when it’s near the support level and selling it when it’s near the resistance level can yield significant gains, especially since it’s a very simple strategy to implement.
Sources Consulted:
1. Mitchell, C. How to trade based on support and resistance levels. https://www.thebalance.com/how-to-trade-based-on-support-and-resistance-levels-4043477
2. Murphy, C. Support and Resistance Basics. https://www.investopedia.com/trading/support-and-resistance-basics/ (2021)
3. Elementary - school of pipsology - BabyPips.Com. https://www.babypips.com/learn/forex/elementary
LimitPrime © 2026
Begin to invest and
start earning today!
Categories
Do you need personalized assistance?
READ MORE INTERESTING ARTICLES

Black Swan event is a metaphor used for the events, particular activities, or transactions that cannot be predicted or even expected to...
Read More
We have already posted about the two best day trading strategies that we recommend. Here, we will continue and write about the remainin...
Read More
After you established that your trading style is day trading, you can now think of a strategy around it and how to make it work best fo...
Read More