Day Trading Strategies (Part 2)

We have already posted about the two best day trading strategies that we recommend. Here, we will continue and write about the remaining two.
Trend trading
Trend trading is a method traders use to determine the current direction of a security and its momentum. It attempts to capture gains by analyzing an asset's momentum in a particular direction. The main goal of trend trade is to use price action to detect profits. Trend traders buy into uptrends and sell into downtrends, taking advantage of buying low and selling high. This strategy is a fundamental type of trading. Fundamental analysis is the process of analyzing and evaluating the economic, financial, social, and political forces that affect supply and demand for a particular asset.
The trend trader enters into a long position when the asset's price is trending upward and a short place when the trend is downward. Trend traders exit positions when the trend reverses and have no desire to ride out retracements (countertrends) of the overall trend.
How to benefit from trend following?
Trend traders believe that prices tend to move in a given direction for a while. When that happens, they attempt to identify and profit from these trends. For example, if they see an uptrend, they will buy with the expectation that the price will continue rising. They may sell during the trend if they think it loses strength or reverses. A downtrend would result in short selling with expectations that prices will continue dropping.
To do this, a trader needs sound market knowledge and trading experience. Traders must also keep both eyes open for the signals and wait for one that will make the trend change course. For example, if there has been an upward trend in the price of an asset and traders spot a signal that a price decrease is coming, they will aim to make a profit from the reversal of that bull trend. If you are interested in finding out more about how to recognize trend reversal, click here.
Trend trading indicators
Trend traders enter a position based on the prevailing trend and then hold the position until the trend reverses or shows signs of reversal. If you are new to Forex trading, one of the first, most important things you can learn about is identifying a trend. Once you understand what drives trends and identify them, you can use this information to make better trading decisions.
A market trend is a perceived tendency of financial markets to move in a particular direction over time. These trends are classified as secular for long time frames, primary for medium and secondary for short time frames. Traders attempt to identify market trends using technical analysis, a framework that characterizes market trends as predictable price tendencies within the market when the price reaches support and resistance levels, varying over time.
Trend indicators such as moving averages (MAs), support and resistance levels, channels, and others determine whether a trend exists, how long it has been in place, and whether they should enter or exit the market. Most traders use more than one indicator to achieve a higher level of accuracy. Here are some of the mostly used indicators:
- Moving average. It sums up the data points of a financial security over a specific time period and divides the total by the number of data points to arrive at an average. It is called a “moving” average because it is continually recalculated based on the latest price data. Analysts use the moving average to examine support and resistance by evaluating the movements of an asset’s price. Most popular options include 50, 100, and 200-day moving averages. The moving average does not predict prices. It moves much slower than the actual market, but it can be helpful for traders as they will confirm whether an asset is moving up in price. Prices above the moving average mean that the overall trend is up.
- Relative strength index. The relative strength index is a momentum indicator that looks at the pace of recent price changes to determine whether a stock is ripe for a rally or a selloff.
Market statisticians and traders use the RSI with other technical indicators to identify opportunities to enter or exit a position.
When the RSI surpasses the horizontal 30 reference level, it is a bullish sign and when it slides below the horizontal 70 reference level, it is a bearish sign.
Range trading
Markets only trend about 30% of the time. This fact presents a problem for traders looking to capture big moves. The rest of the time markets tend to trade in a range, but what does this mean?
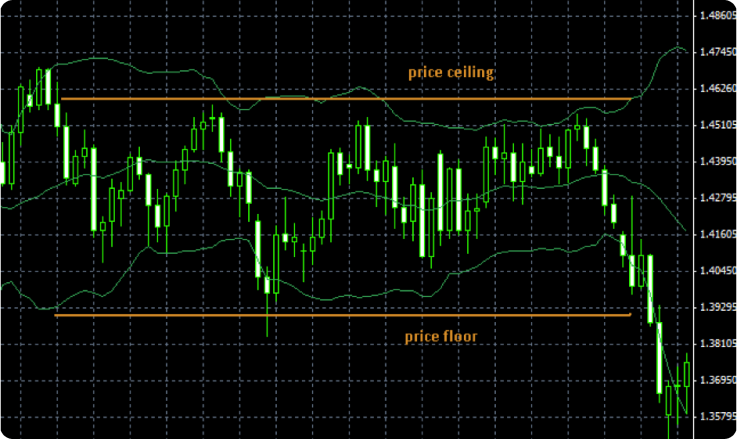
Range trading (or channel trading) is a day trading strategy where traders must pay close attention to the support and resistance areas. Support and resistance areas are top and bottom boundaries for the price. When using technical analysis of price movement between support and resistance levels, range traders buy during support periods and sell during resistance periods.
How to recognize it?
A trading range occurs when a market moves consistently between two prices or levels for a definitive period of time. Like trend following, which can be used on any time frame, range trading can be seen in all time frames, from short-term five-minute charts to long-term daily and monthly charts.
Usually in trend following traders will go with the overall direction of the trend, and buy dips in a rising trend and sell rallies in a falling one.
By contrast, range trading allows a trader to do both, since by definition a price is moving between two clear levels and (in that time frame at least) is making no progress either upward or downward. Range trading needs enough volatility to keep the price moving, but not so much that the price breaks out of the range and starts a new trend. Regarding this, range trading is the complete opposite of trend trading because it works best in the absence of a trend.
Trading Range Strategies
Range-bound trading is a trading strategy that seeks to identify and capitalize on stocks trading in price channels. After finding major support and resistance levels and connecting them with horizontal trendlines, a trader can buy a security at the lower trendline support (bottom of the channel) and sell it at the upper trendline resistance (top of the channel). Here are the most common strategies used while range trading.
Support and Resistance
A trading range occurs when a security trades between consistent high and low prices for a period of time.The top of a security’s trading range often provides price resistance, while the bottom of the trading range typically offers price support. If a security is in a well-established trading range, traders can buy when the price approaches its support and sell when it reaches the level of resistance. Technical indicators, such as the relative strength index (RSI), stochastic oscillator, and the commodity channel index (CCI), can be used to confirm overbought and oversold conditions when price oscillates within a trading range.
For example, a trader could enter a long position when the price of a stock is trading at support, and the RSI gives an oversold reading below 30. Alternatively, the trader may decide to open a short position when the RSI moves into overbought territory above 70. A stop-loss order should be placed just outside of the trading range to minimize risk.
Breakouts and Breakdowns
When a stock breaks through or falls below its trading range, it usually means there is momentum (positive or negative) building. A breakout occurs when the price of a security breaks above a trading range, while a breakdown happens when the price falls below a trading range. Typically, breakouts and breakdowns are more reliable when they are accompanied by a large volume, which suggests widespread participation by traders and investors.
Many investors look at the duration of a trading range. Large trending moves often follow extended range-bound periods.Traders can enter in the direction of a breakout or breakdown from a trading range. To confirm the move is valid, traders should use other indicators, such as volume and price action.
For instance, there should be a significant increase in volume on the initial breakout or breakdown as well as several closes outside the trading range. Instead of chasing the price, traders may want to wait for a retracement before entering a trade. For example, a buy limit order could be placed just above the top of the trading range, which now acts as a support level. A stop-loss order could sit at the opposite side of the trading range to protect against a failed breakout.
Essentials to remember
To start trading, traders first must find the range, then enter it and lastly manage the risk.
Traders use support and resistance zones to find a range. A price must recover at least twice from the support/ resistance area.
Traders can enter a trade manually, by using limit orders or through the use of an oscillator (RSI, CCI and Stochastic oscillator).
When support or resistance level breaks, traders should exit any range-based positions.
Range trading is a useful skill to have. As noted at the beginning, most markets do not trend all of the time. Indeed, trends are relatively rare. Range trading allows traders to take advantage of these non-trending markets. It is not possible to know when a range begins or ends, and thus traders should not try to preempt a market, but wait until the range has been established.
Conclusion
In this and previous article we wrote about the four most common day trading strategies (scalping, news trading, reversal and range trading). Each one of them has its specifications and is suitable for different traders. To read about scalping and news trading, click here.
Trend trading strategy is simply trading according to the trend. Trend traders must stay ahead of the markets and detect the signals that signify a reversal of a trend, which is the point when they start trading.
Range trading is the opposite of trend trading. Since trend changes are not so common, there are traders that like to trade in a defined range of price movements. This range is defined with resistance and support level and stops when a new trend occurs.
When choosing and creating a strategy, you should consider your personality traits and your trading goals. Nevertheless, never start trading without clearly set goals and a predefined strategy.
Sources Consulted:
1. News trader. https://corporatefinanceinstitute.com/resources/knowledge/trading-investing/news-trader/ (2020)
2. Your guide to day trading. https://capital.com/day-trading
3. What is range trading? - fidelity. https://www.fidelity.com/learning-center/trading-investing/trading/range-trading
4. MarketBeat Staff. What are popular range trading strategies? MarketBeat.com https://www.marketbeat.com/financial-terms/what-are-popular-range-trading-strategies/ (2019)
5. England, W. The 3-step range trading strategy. https://www.dailyfx.com/forex/education/trading_tips/chart_of_the_day/2014/03/12/The_3_Step_Range_Trading_Strategy.html
6. Guides, T. S. Best Range Trading Strategy – Trading the Price not Time. (2020)
7. Watkins, G. Range trading: A simple forex strategy explained.https://www.valutrades.com/en/blog/range-trading-a-simple-forex-strategy-explained
8. Analyst, I. G. Range trading explained. IG https://www.ig.com/en/trading-strategies/range-trading-explained-190513 (2019)
LimitPrime © 2026
Begin to invest and
start earning today!
Categories
Do you need personalized assistance?
READ MORE INTERESTING ARTICLES

Black Swan event is a metaphor used for the events, particular activities, or transactions that cannot be predicted or even expected to...
Read More
After you established that your trading style is day trading, you can now think of a strategy around it and how to make it work best fo...
Read More
Fundamental and technical analysis are two of the most common forms of analysis when it comes to trading. Even though you will meet inv...
Read More