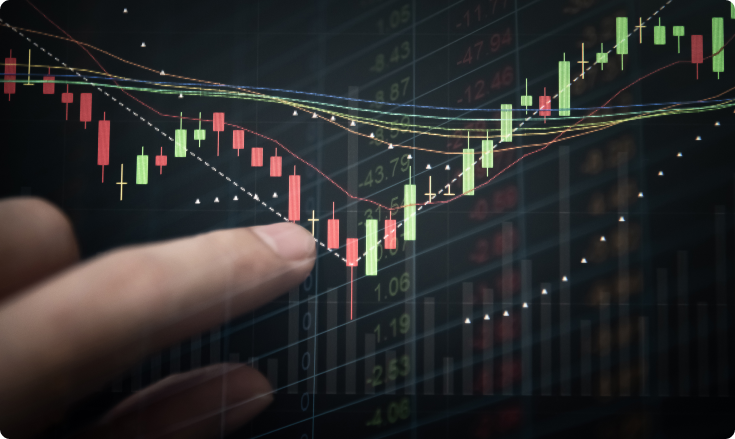
How to Recognize a Trend Reversal?
“How can I recognize a trend reversal?" is one of the most common questions that we get from our experienced clients.
Trend reversals aren’t always difficult to spot and sometimes they can be very obvious. However, what is often the case is that the traders overcomplicate their analysis or ignore obvious signs, deeming them too evident.
While it might not be possible to predict every trend reversal, there are some things that you can watch out for which could indicate a potential turning point of a trend.
But first, let’s discuss what a trend reversal is.
What is a trend reversal?
A trend reversal is a reversal in the price direction of a trading instrument. It can be a reversal going upside or downside. If it follows an uptrend, the reversal is to the downside and vice-versa. Reversals are usually influenced by longer-term price movements and not just by the latest price candles.
Capturing a trend reversal can be very profitable. If you manage to buy an asset when its price is at a low and you see a pattern signaling that it might reverse to the upside soon, you stand to profit if the prediction comes true. However, if you have a position in an asset and you detect a pattern that might signal a reversal to the downside, it might be a good time to sell that asset. You could also decide to short an asset that looks like it might see a significant price drop.
Of course, as with most trading tactics, spotting reversals is much easier said than done. 
How to recognize a trend reversal?
Let’s take a look at some methods that can help you spot reversals early, in order to increase profits and spare your portfolio from losses.
Method #1: Pivot Points
One way to see if the price is staging a reversal is to use pivot points.
Traders use pivot points to calculate the low, high and closing prices of an asset of an earlier trading session. They can be used to project the support and resistance levels of the next trading session.
If an instrument is going through an uptrend, traders will keep an eye out on the lower support points and wait for them to break.
In case of a downtrend, the traders will look at the highest points of resistance and wait for the price to go through them.
If support or resistance points are broken, we could be heading for a trend reversal.
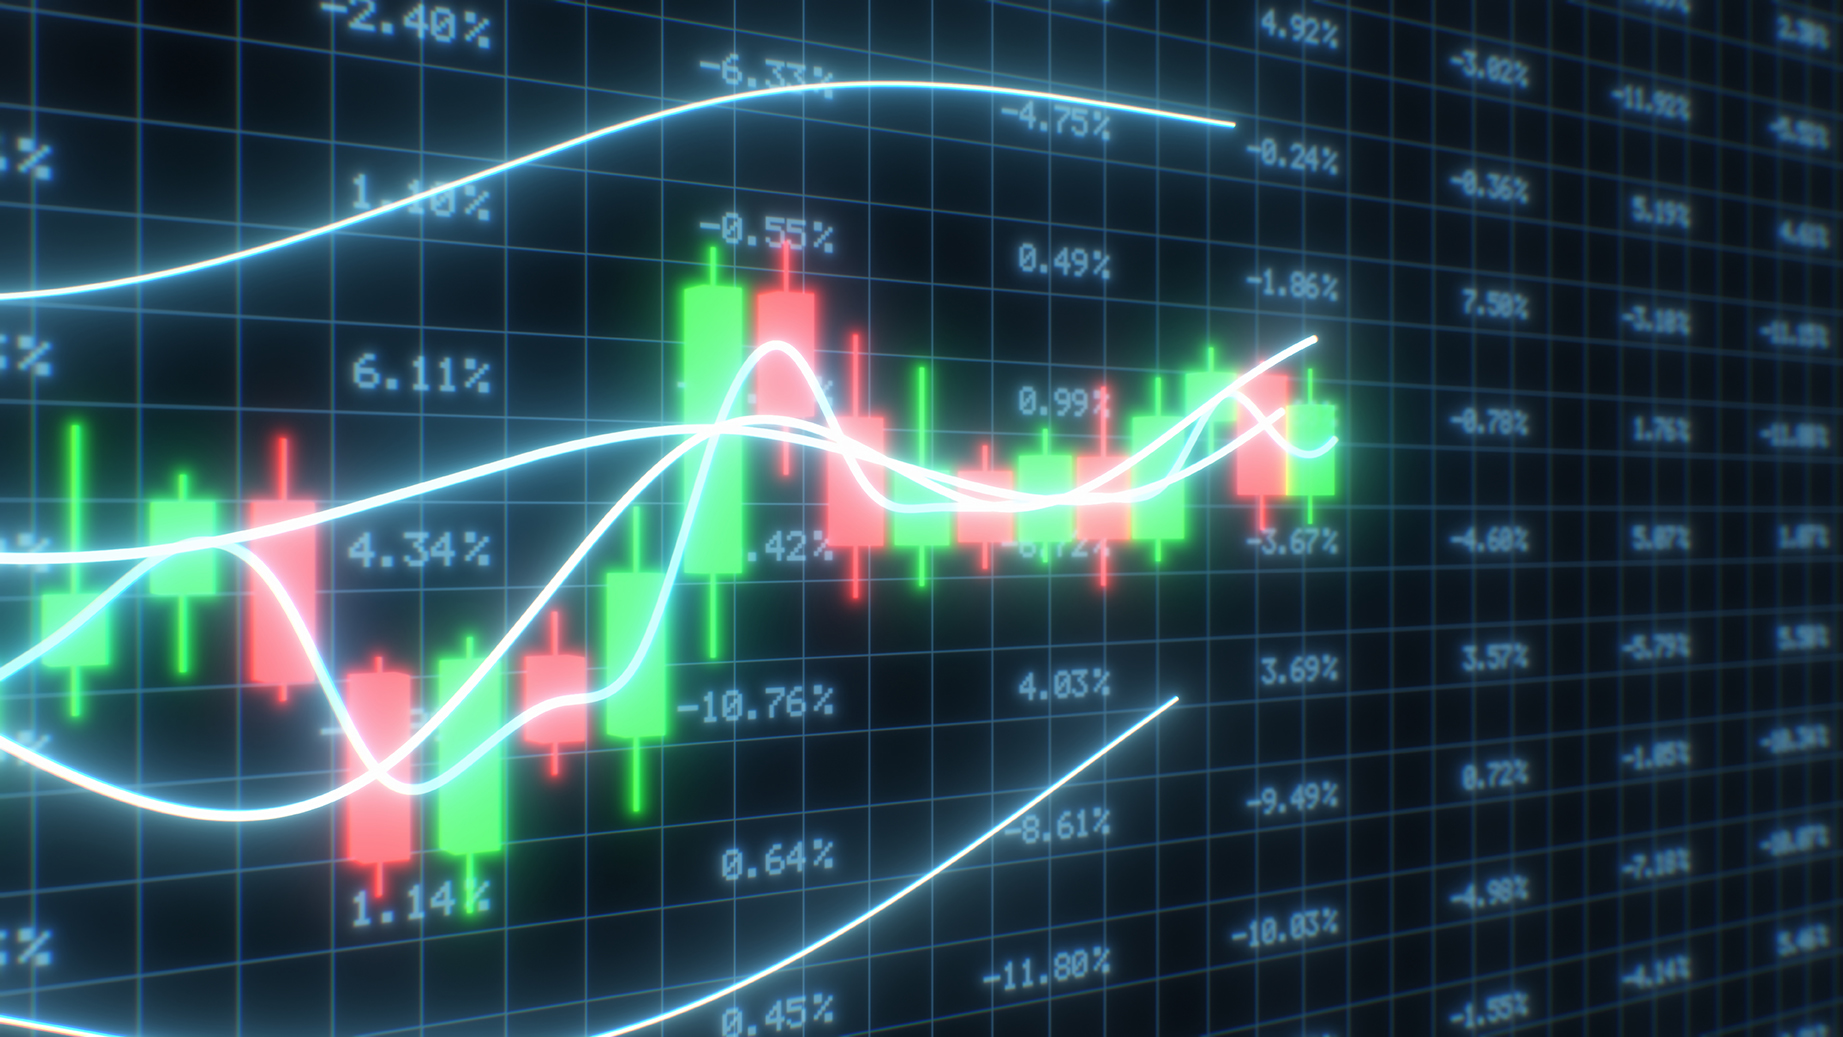
Method #2: Trend Lines
Another method of predicting a trend reversal would be to use trend lines.
Traders can connect a series of prices by using a line called a trendline. Trendlines can be used to project future price movements of an asset by analyzing the previous price levels.
Eventually, a trend line will be broken which signals a potential trend reversal.
While trend lines by themselves might be a weak indicator, traders can use them in combination with candlestick chart patterns to more accurately predict upcoming trend reversals.
Method #3: Fibonacci Retracement
Another way to predict a reversal is to use Fibonacci retracement levels.
Fibonacci retracement levels are lines that show the price at which resistance and support levels are most likely to appear. Fibonacci numbers are the basis of Fibonacci retracement levels. Fibonacci levels are shown as percentages which indicate by how much the price has retracted until that moment. The retracement levels are 23.6%, 38.2%, 61.8%, 78.6% and (unofficially, but also used) 50%.
Price retracements usually hover around 38.2%, 50.0% or 61.8% levels before the trend continues. If the price moves beyond these levels, it’s a sign that a reversal might be starting. 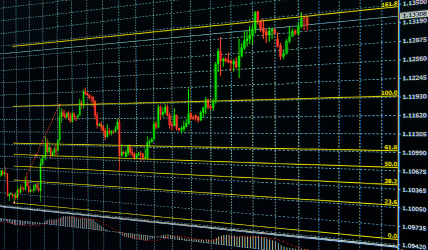
Conclusion
While these are some of the most popular ones, the methods that we’ve listed here aren’t the only ones that you can use to identify trend reversals. In the end, the thing you can rely on the most when evaluating market trends is your own trading knowledge and experience.
These trend reversal indicators will get you started on recognizing complex market movements and you can rely on them to develop your own methods as you get to know the indicators better.
Sources Consulted:
LimitPrime © 2026
Begin to invest and
start earning today!
Categories
Do you need personalized assistance?
READ MORE INTERESTING ARTICLES
In the world of financial markets, traders are often on the lookout for reliable indicators to help their decision-making process when...
Read More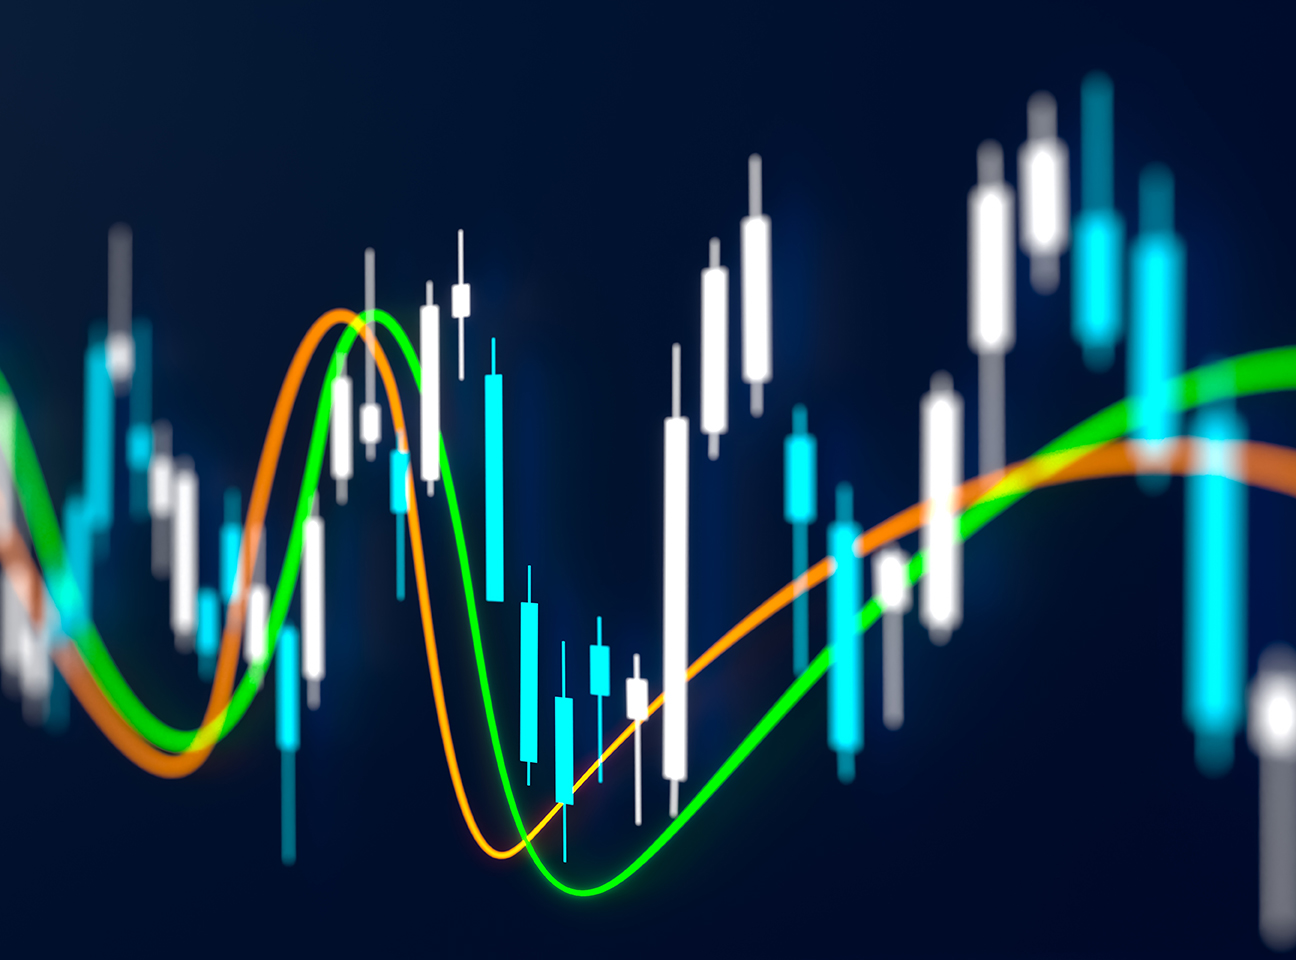
What Is Moving Average Convergence/Divergence (MACD)? Even under ideal circumstances, learning to trade in the right direction of marke...
Read More
When a trader makes an investment decision, he gets exposed to a number of financial risks. The quantum of such risks depends on many f...
Read More