Stochastic Oscillator as a Trading Indicator

What is a Stochastic Oscillator?
Technical analyst George C. Lane created the Stochastic Oscillator in the 1950s. It’s a momentum indicator, used as a tool to predict the performance of an asset. The assumption is that momentum changes precede price changes so it’s based on analysis of the velocity of price changes. Stochastic Oscillator is one of the leading indicators because of its ability to anticipate trend reversals and it can be represented with a value between 0 and 100 within which range it oscillates.
Stochastic Oscillators analyze the high range, low range and last closing price of an asset for a predefined period and we use them for recognizing when the asset goes into the overbought or oversold positions. This indicator follows the assumption that during the uptrends the closing prices move towards the higher end of the range. That means that, during a downtrend, the prices tend to close near the lower end of the range.
Stochastics lines above 80 signal that the market is overbought.
Stochastic lines below 20 signal that the market is possibly oversold.
Stochastics is one of the most popular technical indicators because it’s easy to understand and is very accurate in determining when you should buy or sell an asset.
Stochastics Calculation
K line and D line are used to measure stochastics. The D line is more important to follow since it indicates major signals on the chart. In mathematical terms, the K line is calculated as follows:
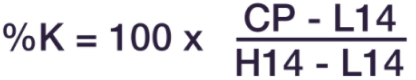
CP = Most recent closing price
L14 = Lowest price of the 14 previous trading sessions
H14 = Highest price of the 14 previous trading Sessions
D line formula:
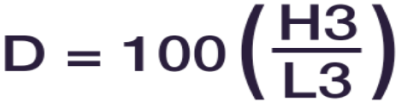
H3 = Highest of the three previous trading sessions
L3 = Lowest price traded during the same three-day period
You don’t need to remember these formulas as modern charting software will do all the calculations for you. They’re just meant to show you how the process works.
Price Action
Price action is one of the main premises of Stochastic Oscillator trading. It refers to the range within which the price of an asset has moved during the daily trading session.
Example: Let’s say the stock opened today at $7.45 and the price went down to $7.20, went up to $7.80 and closed at $7.60. This means that the price action range for that day was between $7.20 (low price) and $7.80 (high price). If the price moves downward, we can expect the closing price to be closer to the low range of the day’s trading session.
Relative Strength Index (RSI)
Technical analysts often use a momentum indicator called the Relative Strenght Index. It’s used in technical analysis to measure the extent of recent price fluctuations and help determine the presence of oversold or overbought conditions in a stock or some other asset.
Relative Strength Index values above 70 indicate that an asset is being overbought and values below 30 indicate that an asset is being oversold and most likely undervalued. Those values can help you determine whether an asset is a good opportunity to buy or when it’s time to sell if you hold the asset.
Stochastic oscillators that have set boundaries on both the high and low points are considered “normalized”. The relative Strength Index is included in that group and is a very important indicator to understand when it comes to trading with stochastic oscillators. It also has a range from 0 to 100, similar to other stochastic oscillators.
Using the Relative Strength Index and stochastics together is another very popular strategy that usually yields better results compared to using just one of those methods for determining price movements.
The relative strength index (RSI) is calculated in two phases:

The average gain or loss used in the calculation is the average percentage gain or loss during the previous period. The formula uses a positive value for the average loss.
The usual approach is to use 14 periods in order to calculate the first RSI value. For example, let’s say that the market has closed higher for 7 out of 14 days with an average gain of 1% and during the remaining 7 days it has closed lower with an average loss of -0.8%. In that case first step of the RSI would take the form of this expanded calculation:
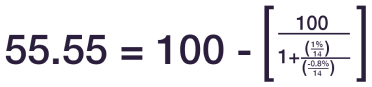
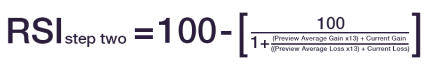
When we have 14 periods of data available, we can calculate the second part of the RSI formula. The purpose of the second part is to smooth out the results.
Conclusion
Stochastics remains one of the most popular trading tools due to its very accurate prediction of future price movements. It’s easy to understand and implement which makes it a staple in every advanced investor’s trading strategy arsenal.
Sources Consulted:
1. Investopedia Staff. Stochastics: An accurate buy and sell indicator. https://www.investopedia.com/articles/technical/073001.asp (2020)
2. How to use Stochastic indicator for forex trading. https://www.babypips.com/learn/forex/stochastic (2011)
3. How to read and use the stochastic oscillator indicator. https://currency.com/how-to-read-and-use-the-stochastic-oscillator-indicator
LimitPrime © 2026
Begin to invest and
start earning today!
Categories
Do you need personalized assistance?
READ MORE INTERESTING ARTICLES
In the world of financial markets, traders are often on the lookout for reliable indicators to help their decision-making process when...
Read More
What Is Moving Average Convergence/Divergence (MACD)? Even under ideal circumstances, learning to trade in the right direction of marke...
Read More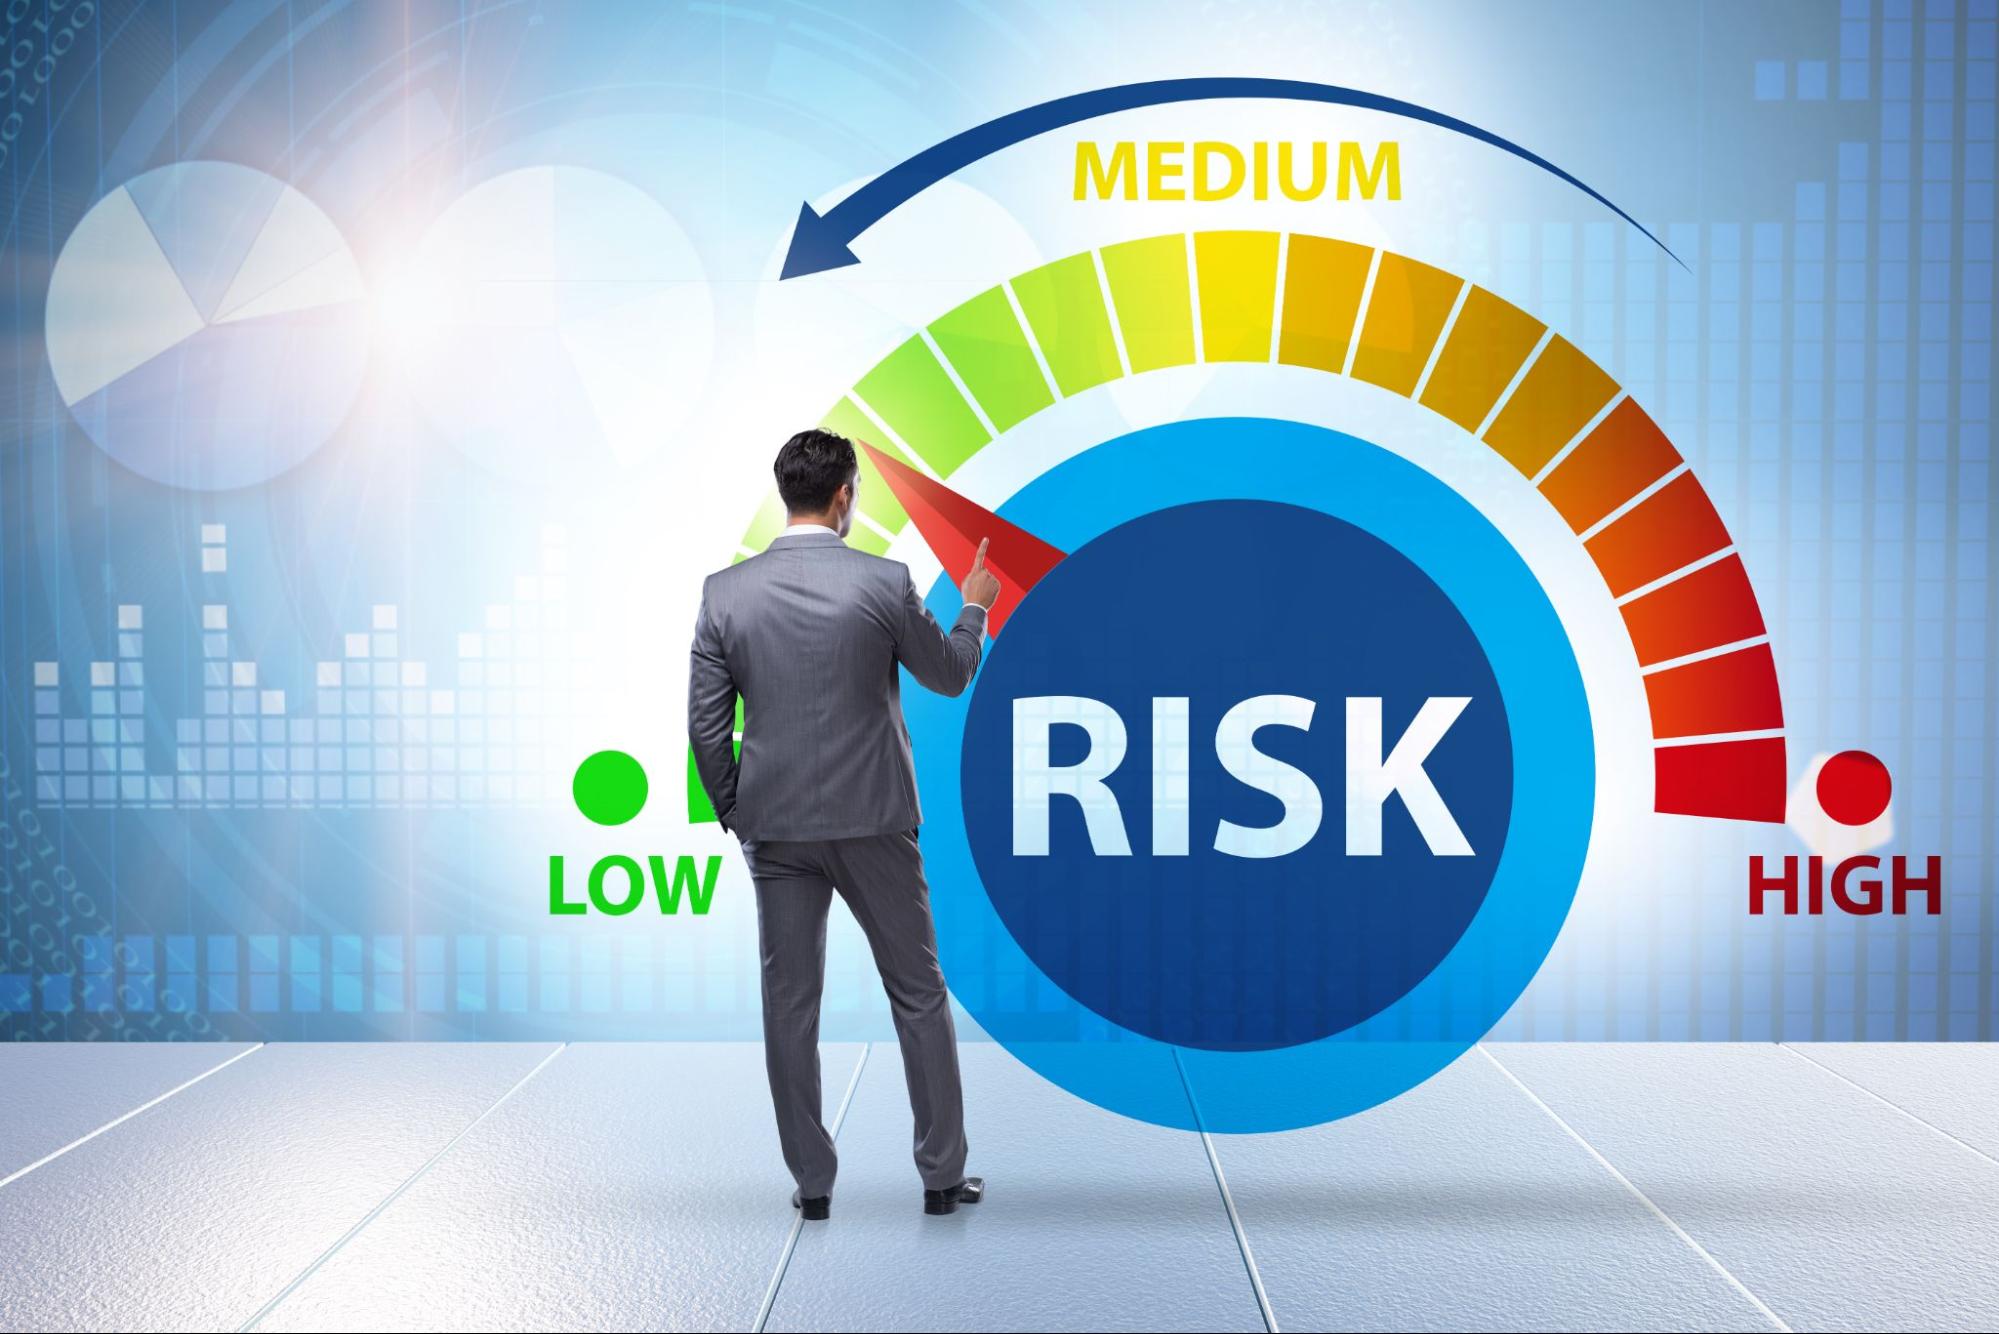
When a trader makes an investment decision, he gets exposed to a number of financial risks. The quantum of such risks depends on many f...
Read More